
Advertisement
We are now releasing the downloadable Pandemic Projection Model (“Adams Model”) spreadsheet, Revision 2, with new features:
- You can alter the starting assumption values to test different scenarios of where the coronavirus pandemic goes in any given nation or population region.
- Fields that can be altered include R0 value, mortality rate, and # of infected individuals on day one.
- New feature: “Social distancing suppression” value allows you to suppress new infections by a percentage you choose. This helps take into account school closures, travel bans and personal contact habits which are already being altered.
You can now download the spreadsheet at this link:
//www.pandemic.news/PPM-Adams-Rev-2.zip
The file format is .xls, compatible with MS Excel and Apache Open Office (free software from Apache).
You will also need to unzip the zip file, of course, after you download it. You can use a utility like 7-zip (7-zip.org) to achieve this.
Once you download the spreadsheet, you may immediately begin altering several variables to test the outcomes they will produce. All rows showing # of infections, # of deaths, etc., are automatically updated (as in any spreadsheet based on relational formulas).
If you use this spreadsheet or cite its numbers, please give credit to Mike Adams, Pandemic.news / NaturalNews.com.
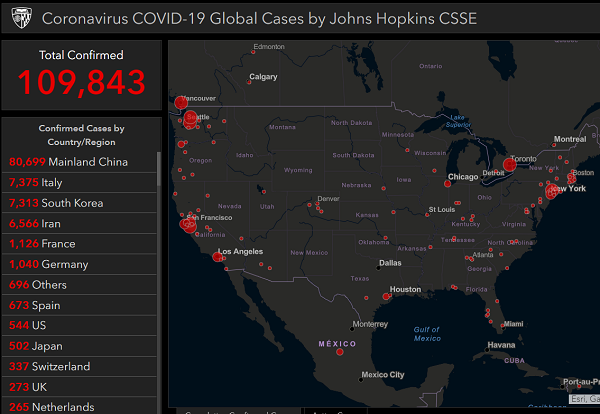
New projections show only 1.1 million deaths in the USA by July 4th if social distancing achieves 25% suppression
The projections of this Revision 2 spreadsheet typically do not match Revision 1, since we have simplified some of the calculations. This has resulted in typically a lower total fatality projection. One piece of good news in this projection is that if you enter an R0 value of 2.4, and use a social distancing suppression value of 25%, there are only 1.1 million deaths in the USA by July 4th.
You are free to modify the values in the spreadsheet yourself, and to republish the spreadsheet as long as you give proper credit to the author.
If you notice any calculation modeling errors in the spreadsheet, please inform us via the NaturalNews.com feedback form so we can improve it for Revision 3.
Additional assumptions in the model:
- The model assumes individuals who are newly infected become infectious themselves the following day, and then remain infectious for exactly 14 days, after which they either become immune (and non-infectious) or die (and are therefore non-infectious).
- You can change the 14-day window in this spreadsheet by altering the references starting with cell E41 which references C27 (notice the difference between the row numbers is 14). Because of the “lag time” calculations, you have to manually alter these cells yourself to create whatever lag time window you want to simulate (such as 10 days, or 20 days). These changes must of course be carried to all subsequent cells in the spreadsheet.
Feel free to run your own projections. Try R0 values of 3.0 or higher to see what happens (if you dare…)
Stay informed. Read Pandemic.news.
Advertisement


Advertisements


NewsTarget.com © 2020 All Rights Reserved. All content posted on this site is commentary or opinion and is protected under Free Speech. NewsTarget.com is not responsible for content written by contributing authors. The information on this site is provided for educational and entertainment purposes only. It is not intended as a substitute for professional advice of any kind. NewsTarget.com assumes no responsibility for the use or misuse of this material. Your use of this website indicates your agreement to these terms and those published on this site. All trademarks, registered trademarks and servicemarks mentioned on this site are the property of their respective owners.
